User feedback and Digital Ethnography
This project serves as part of my digital ethnography side project collaborating with other two friends. I'm in charge of data collecting and analysis to facilitate their works on participative observation and interview. For example, one of the finding after ploting the users' locations is that there are quite a large proportion of users actully use this service outsides US or wear those clothes to travel. We didn't notice this part of people untill the graphic showed us. Therefore, it helped a lot to modify our wishlist of research plan and focus.
Therefore, the main audience of this visualization is my group mates in the digital ethnography group. Here is some of their feedback:
- Visualize hte proportion of usesr who shows their location in the post
- Better to have image with user name and brand in the tooltip when the cursor is positioned over the dots
- Show the proportion of posts outsides US
About the Digital Ethnography
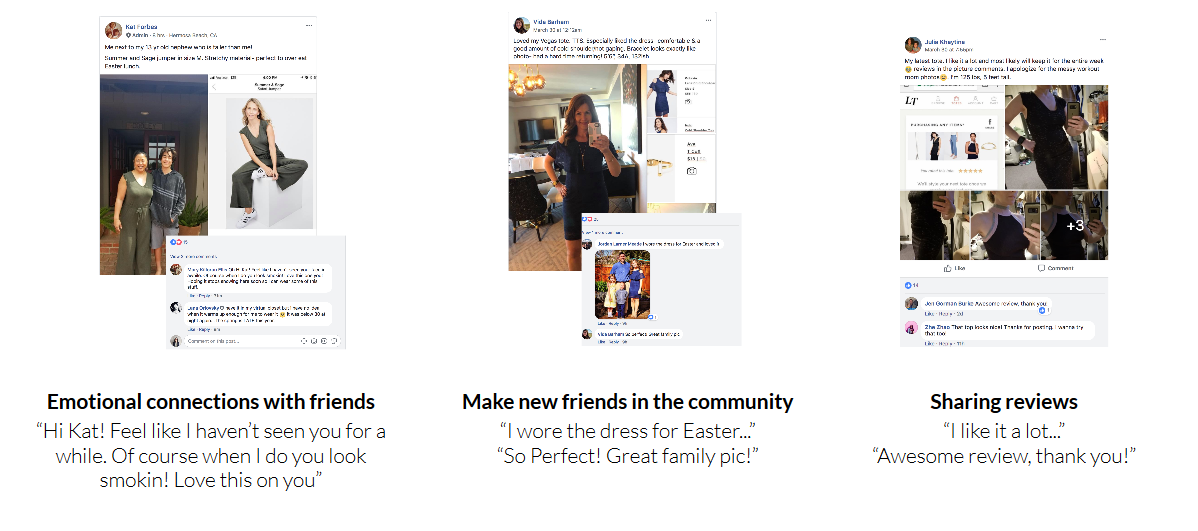
Besides quantitaive analysis I did for the interactive data science midterm project, the major part of this digital ethnography is qualitative. We have done a lot participative observation in digital scenarios by joining facebook groups, interviewing and observing users, subscribing and experiencing the service etc. For instance, the image below summarizes what kinds of actions a user with positive mood may do in a facebook group.